Weights & Biases — Developer Tools for Machine Learning
Co-authors: Anushka Datta, Mansi Goyal
In today’s day and age, Machine Learning models are everywhere, from your voice assistant (Siri, Alexa) to the amazing song recommendations made by your Spotify! Building successful Machine Learning models is a form of art. It is an iterative process wherein engineers and scientists come together to teach computers to learn from their experience. These models take a significant amount of time and effort to reach the optimum performance.
A lot of experimentation and research needs to be done to tune the model architecture and hyperparameters before it is ready to be deployed. When so many people are collaborating on different projects and training multiple models, tracking everyone’s progress becomes a huge headache! Imagine, your model crashes after hours of training. You are already disappointed and then you find out that your teammate had tried these same hyperparameters last week! A huge waste of both your time and resources. This is where Weights & Biases come in!
What is Weight & Biases all about?
“Track, compare, and visualize ML experiments with 5 lines of code.”
To put it in simple words: Weights & Biases (wandb) is a shared logbook of team progress. A one-stop destination for everything related to your next ML model. Track your team’s ML experiments, log hyperparameters and visualize results. Here is a list of their modular tools (as taken from their website):
- Dashboard: Experiment tracking
- Artifacts: Dataset versioning, model versioning
- Sweeps: Hyperparameter optimization
- Reports: Save and share reproducible findings
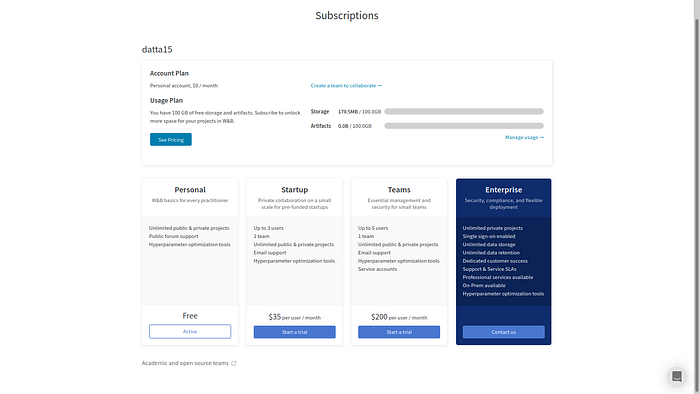
The different user categories targeted by wandb include:
- Practitioners: train and evaluate the model pipeline; share the results.
- Teams: document progress and collaborate within and outside the team; catch performance issues and debug them;
- Enterprise: helps keep data secure; boost productivity and efficiency; centrally manage and monitor models in production;
As you can tell, these are some powerful tools which can make the life of any ML developer easy. With wandb you can easily see which GPU is underutilized, which hyperparameters are working for your model, how your model is improving over time, and so forth! What’s more, its many flexible subscription plans make it a viable option for a wide ranging user base, from students to huge enterprises. We experimented with the tool last week, allow us to share our findings with you in the next section.
Our Experiments with wandb
We integrated wandb with a Movie Recommendation System, a project for our graduate course: Machine Learning in Production. Here are the steps we followed:
- wandb can be easily set up for any Python project. To do so, we must first install the package using our package installer. We used pip:
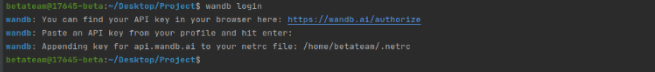
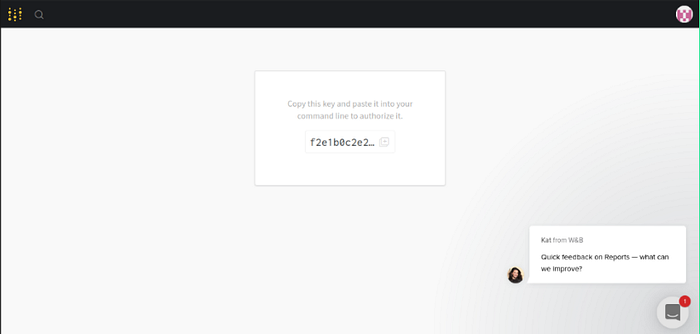
$ pip install wandb- We must then log into our wandb.ai account so we can access the logs.
- We can then import the library into the .py file we are using. wandb.init() spawns a new background process to log data to a run, and it also syncs data to wandb.ai by default so you can see live visualizations. The parameters can be set as seen here.
import wandbwandb.init(project=”Movie recommendation”, name=”L3", notes= “For AI Engg”, reinit= True, save_code=True)
- With this, our environment is set up and we should be able to see our account homepage by going to https://wandb.ai/<username>
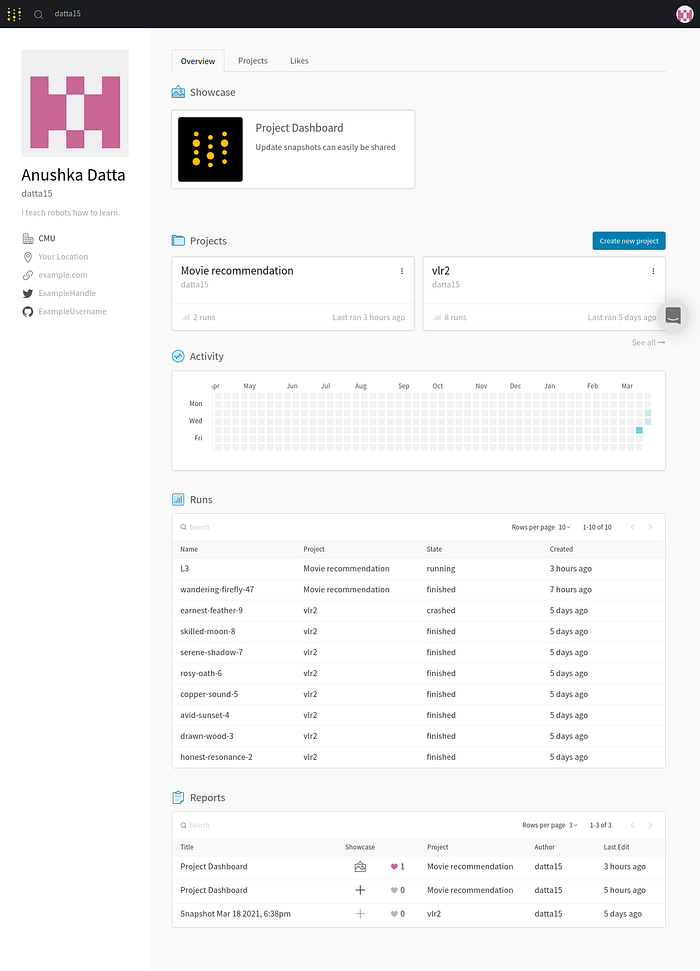
Now that we have our environment set up, we are ready to visualize!
We found wandb to be extremely useful throughout the development process, from ideation to implementation. wandb allowed us to collaborate with our teammates seamlessly. The dashboard showed us which models are running or crashing, how other teammates are utilizing the compute resources etc. It also allowed for code sharing and logging. A welcome change in these extraordinary times when all of us are working remotely.
It helped us visually validate our basic assumption behind the model: users of the recommendation system exist in clusters i.e. users can be split into groups based on the movies they like to watch. We plot the distribution of 5000 users based on their ratings of 500 movies.
table = wandb.Table(data = tsne, columns = [“Feature1”, “Feature2”])wandb.log({“Users” : wandb.plot.scatter(table, “Feature1”, “Feature2”)})

As you can see in the figure, based on our features we were able to easily observe the clusters. This gave us confidence to go ahead with our approach of collaborative filtering.

We also collected telemetry data pertaining to our model that helped us optimize our architecture. For example, through the recommendation time recorded by wandb, we observed how long our model is taking to return recommendations for different users. The graphical representation of the same was a huge plus! We can now observe if we have unusual spikes without going through pages on pages of logs.
wandb.log({‘recommendation time’ : (response_time — request_time)})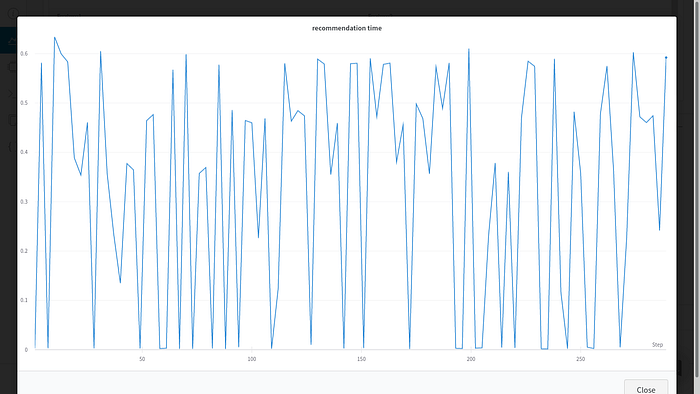
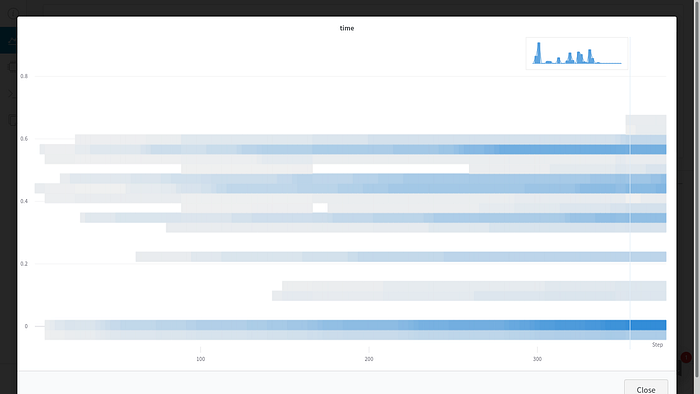
We can also visualize the overall distribution of response time as a histogram at any point. As we can observe, our model is working as desired and recommendations are being sent out in less than 800ms.
times = np.hstack((times, np.asarray([(response_time — request_time)])))wandb.log({“time”: wandb.Histogram(times)})
Here are the final movie recommendations returned by our model as captured on the wandb dashboard:
table = wandb.Table(data=user_recs, columns=[“User”, “Recommendations”])wandb.log({“User recommendations” : table})

Strengths and Limitations of wandb
Our experiments with Wandb gave us a fair idea about the many features of wandb. Here is our take on what worked for us and did not:
Strengths:
- Friendly User Interface: We found it to be easy to use! This tool is like github for ML development!
- Dashboard to track the team’s progress.
- A good tool to monitor the training of deep learning models over time. For example: we can use it to track the learning rate, loss, accuracy in a neural network over time and also visualise the histograms of weights and biases(so punny).
- Empowers collaboration across teams. For instance, there is transparency in who is trying which approach and hence avoid redundant work.
- Allows data and notebook versioning.
- Supports integration for a number of languages and frameworks! (Full list here.)
- Automatic generation of reports and logs. These reports capture everything from model results to system optimizations ensuring that your next team presentation is a big hit!

Limitations:
We found the tool to be unsuitable for use in production as it is quite heavy (as we have used it). To record accurate metrics for our model, we ran our recommendation system on a single thread which is not scalable. Therefore, during production, we would recommend collecting the data and feeding it externally to wandb. However, if your requirement is to integrate into the production system then plausibly an enterprise subscription would serve you better!
Additionally, wandb does not support R and Scikit-Optimize.
Conclusion
We had a great time playing around with wandb! Its ease of use makes it a great candidate for tracking the progress of ML models.
Pssst.. Students get one free team! Go sign up for it!